Do Our Unlimited Choices Limit Our Shared Experiences?
by
Deena Kuchinsky
Contemporary Issues 3 (BHSC-295-DLB)
Professor Desir
December 7, 2007
Mass media, a term coined in the 1920s and describing the enormous audience reached, now reflects the diversity of humanity. Technology has driven the growth of mass media. Due to changes in technology over the past few decades, content producers and media companies can offer material tailored to anyone's taste. Even more significantly, anyone with an Internet connection can broadcast. I will discuss the trend of the limited content choices of the past few decades versus the almost infinite variety of choices in today’s world. Do we have fewer shared experiences today? Did the limited choices of yesteryear connect people more than the many choices of today?
In 1453, Johannes Gutenberg printed the first book with movable type on a printing press. This invention transformed the world.[1] The printing press reduced the cost of producing a book; what once took months now took days, so great quantities could be produced. Anyone who could read could have one. The development of motion pictures and radio in the 19th Century had a similar effect. But now the audience was not limited to the literate: Authors could reach the masses. Perhaps just as importantly, the masses could be reached simultaneously. The reader, even of a newspaper, is a singular audience. Unless the words are read aloud, no one else shares in the experience. Of course, one may discuss the work later, perhaps over coffee, but the experience of motion pictures, or of radio, or, later, of television, is shared.
Each of these media is more like live theater than reading. Motion pictures were shown in theaters. To see them, one left home and paid the price of admission, then sat in a darkened room while images danced and flickered on the screen. The experience of the theater and the film was shared with the other members of the audience. The venue was not a darkened theater but a tavern or a living room, but listening to radio plays or watching television were social events. Or, at least they were on The Waltons.[2] A friend of our family recalls joining his parents and their friends for dinner parties around the television.
Television broadcasts, like
radio, were useless unless one bought a receiving set. The broadcasts were only
so many electromagnetic waves without the technical equipment to turn those
waves into a picture, stations to broadcast them, and pictures to broadcast. At
the 1939 World’s Fair in joe
that he should invest the family savings in a radio with pictures. In 1948,
“[t]he income of the average (mean) family was $3,200, or about $150 higher
than in 1947 and about $600 higher than in the war years of 1944 and 1945.”[5] The
equipment was expensive: a 1948 General Electric 10” tabletop model had a
retail price of $325, or $2,939.44 in today’s dollars,[6] more
than one month’s salary (chart 1). Early sales were to taverns and other
establishments where the novelty of the television could be used to attract
customers. But expectations were high. A 1948 article in Time magazine discusses how television set production was far below
demand, mentioning that Philco Corporation’s 1948 output would exceed the
industry’s 1947 production of 175,000 sets. “Once more the industry revised its
production figures upward; it now expects to turn out more than 750,000 sets
this year. Dr. Courtnay Pitt, economist for Philco, predicted an increase to
1,500,000 next year, 2,500,000 in 1950, and a total of 5,000,000 sets in use by
the beginning of 1951.”[7]
The number of households with
television sets in 1951 exceeded expectations: 10,320,000.[8] However,
because of the high cost of owning and operating a television station, and of
producing television shows – as well as the technical and regulatory
limitations of the medium – viewing options were limited. The Federal
Communications Commission, which regulates use of the electromagnetic spectrum
and communications in the
While by 1961 90% of the
households in the
Television in the
As a result of this limited content, people of different cultures and ethnicities, at least those who could afford a television set, mostly watched the same material. The nation, or rather that fraction of the nation which owned a television, waited excitedly for Lucy and Ricky’s baby to be born. During 1953-54 season, I Love Lucy gained an audience share of 58.8%, out of 26,000,000 homes. But this was only 18,052,000 households, and 38.44% of the general population. A conversion of the television ratings from percentage values to the number of households shows that a definite trend. The top-rated television shows tend to appeal on average to 20 million households (chart 3). The great exception was The Cosby Show, between 1985 and 1988, which appealed to, on average, 28 million, and peaked at 31 million. Even this was just over a third of the population.
“One key development in North American culture since the 1970’s, especially evident in the media, is a general shift from massification to segmentation,”[15] enabled by technological and regulatory changes, such as videotape and additional frequencies made available for use by cable television. But this market segmentation could be as easily laid at the feet of the coming of age of a different generation of advertising executive. One who realized that while the top shows garnered at 21% market share, everything else held 79%. The additional frequencies allowed experimentation, to find those 71% of buyers who would watch a golf channel, a home repair channel, a Catholic channel, an infant baby channel, or a gay and lesbian channel, and not simply those buyers who would watch Happy Days.
Kottak and Kozaitis assert that “[n]ew technology has the capacity to tear all of us apart as it brings more of us together.”[16] We become more focused on our personal wants, rather than sharing experiences with the rest of the nation. What are my interests? What is on my television, my Internet? While the arrival and broad personal use of the Internet allowed for special interest groups to be even more distinct and separate, people from all over the world can be united by the use of different online forums and websites. There is a niche for any perversity. The life online is social,[17] but can be to the detriment of life in the real world.[18]
The World Wide Web and fast connections to the Internet have enabled anyone to reach, possibly, a mass audience often many times than that of television. It is world-wide. The costs of production equipment are within reach of all but the poorest -- $150 for a video camera, $500 for a computer, $20 per month for Internet access, and some software that usually comes with the computer or camera. The Pew Internet and American Life Project reported that 45% of Internet users had published online something they created themselves.[19] It is because anyone can create anything that mass media now reflect the diversity of humanity. Our communications are not filtered through someone else’s taste.
There are natural limits to mass communications media determined by the audience’s interest in the material being presented. This appears when the audience, whether reader or viewer, is presented with a variety of choices. Thus not everyone reads the bestselling novel,[20] nor watches the highest-rated television show. Does this result in fewer shared experiences? As we have seen, roughly the same number of people watched the top television shows then as now. Not only are there more choices, but there are more people. The idea that we all shared the same mediated experiences does not hold up to examination. Those experiences we share are, and will be, those common to humanity.
Charts
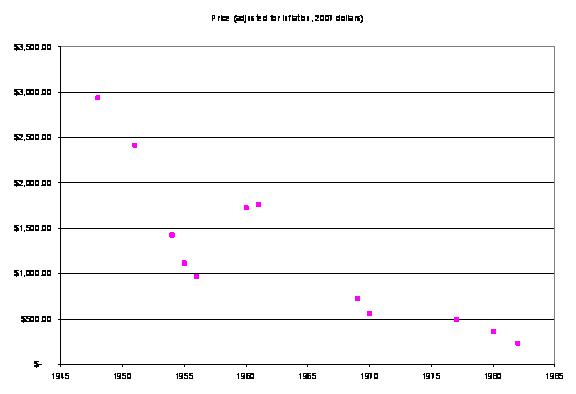
Chart 1, showing the prices of selected television sets adjusted for inflation. Source: “TV Selling Prices,” Television History – the First 75 Years.
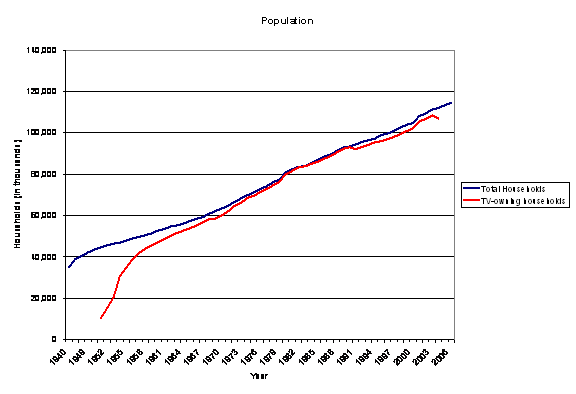
Chart 2, showing the television-owning population
in comparison with the general population (numbers in thousands). Source: “HH-1,
Households, by Type: 1940 to Present,”
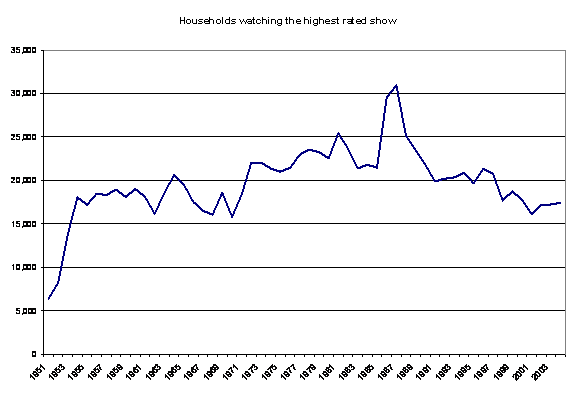
Chart 3, showing the population reached by the highest rated show rather than as a percentage of the television-owning population (numbers in thousands). Except for The Cosby Show, the highest rated shows appealed to no more than 25,000,000 viewers, with the majority substantially less. Source: “Highest Rated TV Shows of Each Season: 1950-51 to 2004-05,” World Almanac (2006).
References
Cabletelevision Advertising Bureau. “Cable Programming Reaches 85% of all Television Households.” http://www.onetvworld.org/?module=displaystory&story_id=1480&format=html
Federal Communications Commission. “Historical Periods in Television Technology.” http://www.fcc.gov/omd/history/tv/
High-Tech Productions. “The History of Film and Television.” http://www.high-techproductions.com/historyoftelevision.htm
Horrigan, John B. “Home Broadband Adoption 2006.” Pew Internet and American Life Project. http://www.pewinternet.org/PPF/r/184/report_display.asp
Horrigan, John B., and Aaron Smith. “Home Broadband Adoption 2007.” Pew Internet and American Life Project. http://www.pewinternet.org/PPF/r/217/report_display.asp
Kottak, Conrad
Philip, and Kathryn A. Kozaitis. On Being
Different: Diversity and Multiculturalism in the North American Mainstream
(3rd Edition).
Lenhart, Amanda, and Mary Madden. “Social Networking Websites and Teens: An Overview.” Pew Internet and American Life Project. http://www.pewinternet.org/PPF/r/198/report_display.asp
Meyer, Mary Alice
(August 1987). John Walson - Oral History Collection. CableCenter.org. The
Sony Corporation. “Sony History: The Betamax Case.” http://www.sony.net/Fun/SH/1-31/h1.html
Television History – the First 75 Years. “TV Selling Prices.” http://www.tvhistory.tv/tv-prices.htm
Television History – the First 75 Years. “Television Facts and Statistics, 1939 – 2000.” http://www.tvhistory.tv/facts-stats.htm
“TV Takes Over,” Time, August 9, 1948. http://www.time.com/time/magazine/article/0,9171,794484,00.html
Wikipedia. s.v. “Cable television in the United States.” http://en.wikipedia.org/wiki/Cable_television_in_the_United_States
Wikipedia. s.v. “Mass Media.” http://en.wikipedia.org/wiki/Mass_media
Wikipedia. s.v. “North American broadcast television frequencies.” http://en.wikipedia.org/wiki/North_American_broadcast_television_frequencies
Wikipedia. s.v. “Printing Press.” http://en.wikipedia.org/wiki/Printing_press
Wikipedia. s.v. “Ultra high frequency.” http://en.wikipedia.org/wiki/Ultra_High_Frequency#United_States
Wikipedia. s.v. “Very high frequency.” http://en.wikipedia.org/wiki/Very_high_frequency
World Almanac (2006). “All-Time Highest-Rated Television Programs, 2005.” http://rdas-proxy.mercy.edu:2105/WA/Search/wart01850.asp
World Almanac (2006). “Highest-Rated TV Shows of Each Season, 1950-51 to 2004-05.” http://rdas-proxy.mercy.edu:2105/WA/Search/wart01900.asp
World Almanac (2007). “TV Viewing Shares, Broadcast Years, 1990-2005.” http://rdas-proxy.mercy.edu:2105/WA/Search/wart41650_07.asp
World Almanac
(2006). “
This is a
most interesting and informative paper.
It disabused me of my idea that radio and T.V.(limited to that certain
number of channels) gave us more shared experiences. Thank you.
I learned a great deal from your paper.
A+